Headless BI: Metric Standardization in Action

Metric standardization is a hot topic at the moment. Companies are deploying various solutions — metrics stores, metrics layers, and headless BI platforms — to provide consistent metrics to all of their data tools to avoid the danger zone of inconsistency.
This article provides a simple example of metric standardization, where different data consumers — SQL client, data science IDE, BI platform, and React application— access a headless BI platform, consume the same metrics, and achieve consistent results.
What is headless BI?
Headless BI means we separate the analytical backend and computing from consumption. This decoupling allows us to expose the universal semantic layer to multiple data tools via APIs and standard protocols.
Because all data consumers thus have access to a single source of metrics, our data engineers, analysts, and end-users can work with consistent metrics — with the same meaning for everyone — with the tools of their choice.
Setting up the headless BI platform
This article uses GoodData.CN Community Edition to introduce the concept of headless BI. GoodData.CN CE runs on our local machines as a container, and we will configure it with the GoodData Foreign Data Wrapper (FDW) needed for the headless BI use case.
GoodData.CN CE
To follow this article, you can download GoodData Python SDK, which contains a docker-compose file, and run the following command in the root folder:
$ docker-compose up -dThe docker-compose command starts both the GoodData.CN Community Edition and GoodData FDW containers and loads predefined analytical objects — data connector, semantic model, metrics, visualizations, and dashboard— into GoodData.CN.
Once the containers are running, let’s go to http://localhost:3000/ and log in to the platform.
User: [email protected]
Password:demo123
Below is the logical data model for the Demo workspace created with the docker-compose. Later, this model and a Revenue metric are exposed to external data tools.
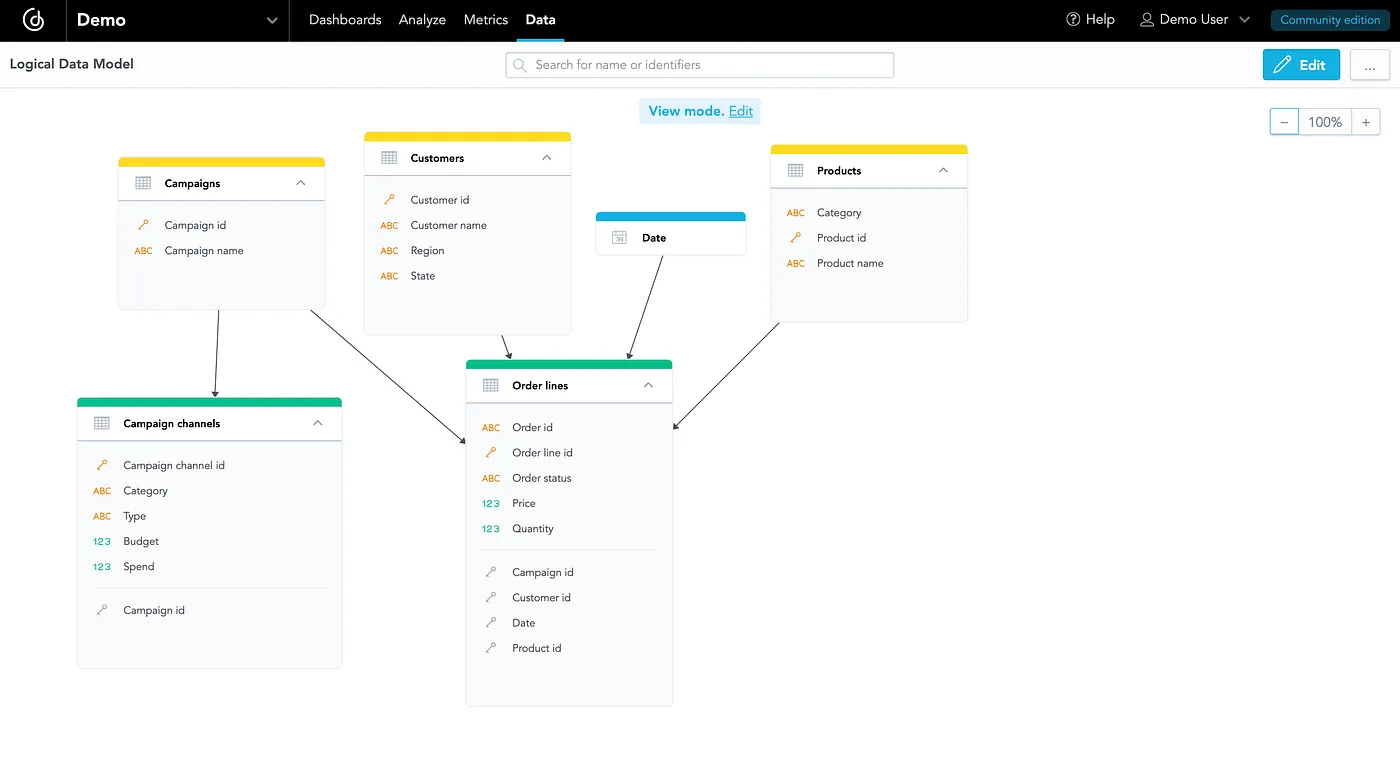
The predefined analytical objects also contain a Revenue metric. The metric uses another metric —Order Amount that calculates the income of all orders —and counts revenue only from delivered orders (order status is not Returned nor Canceled).
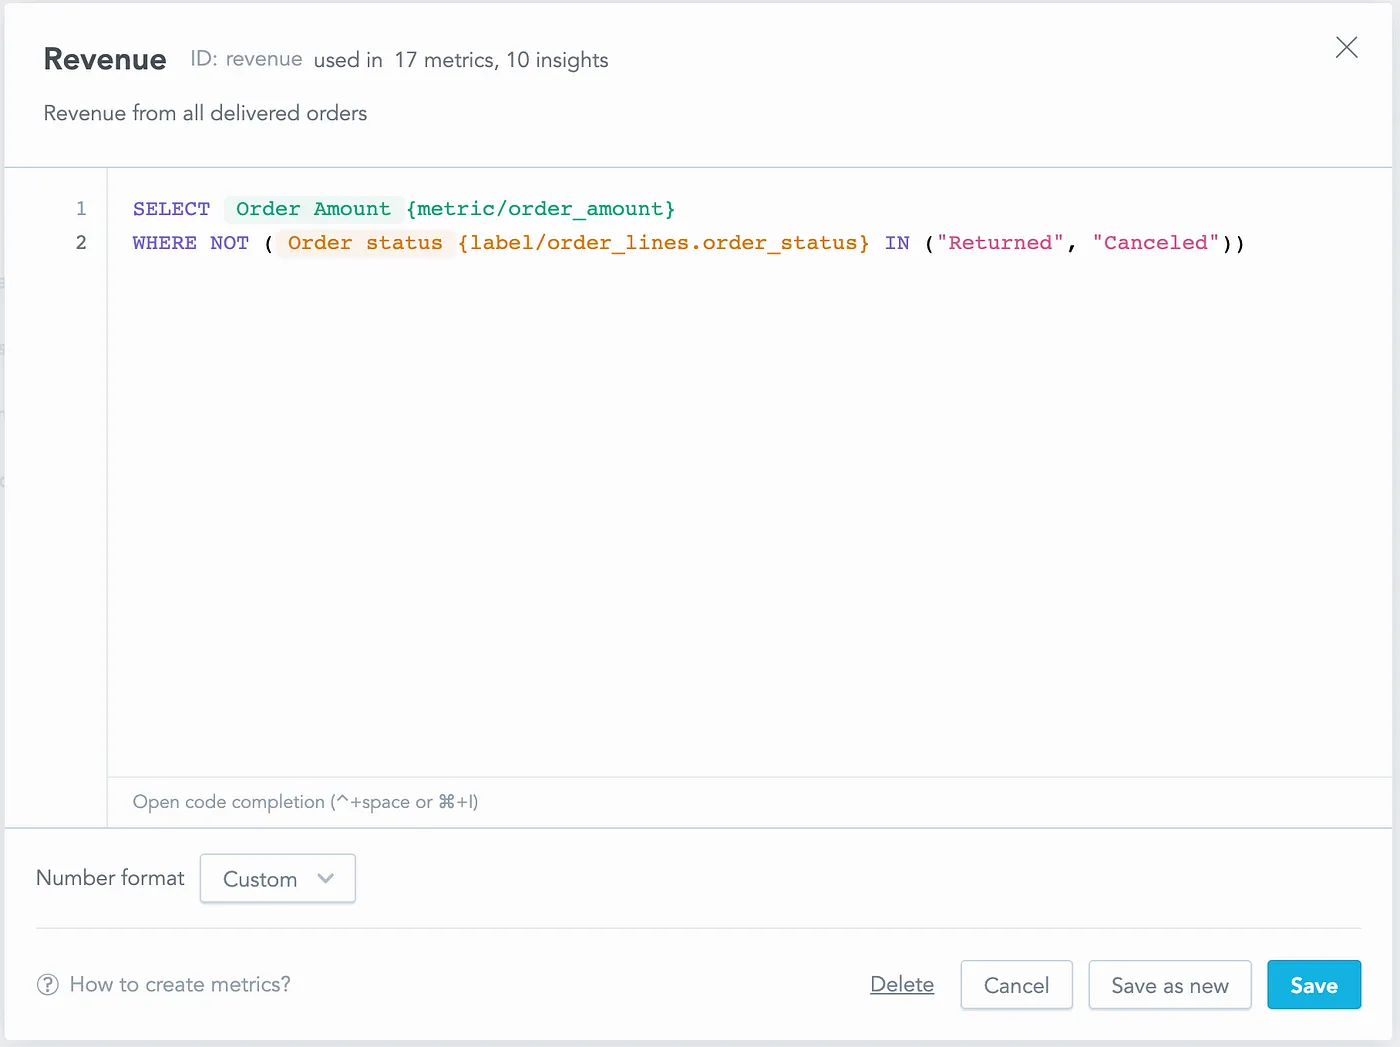
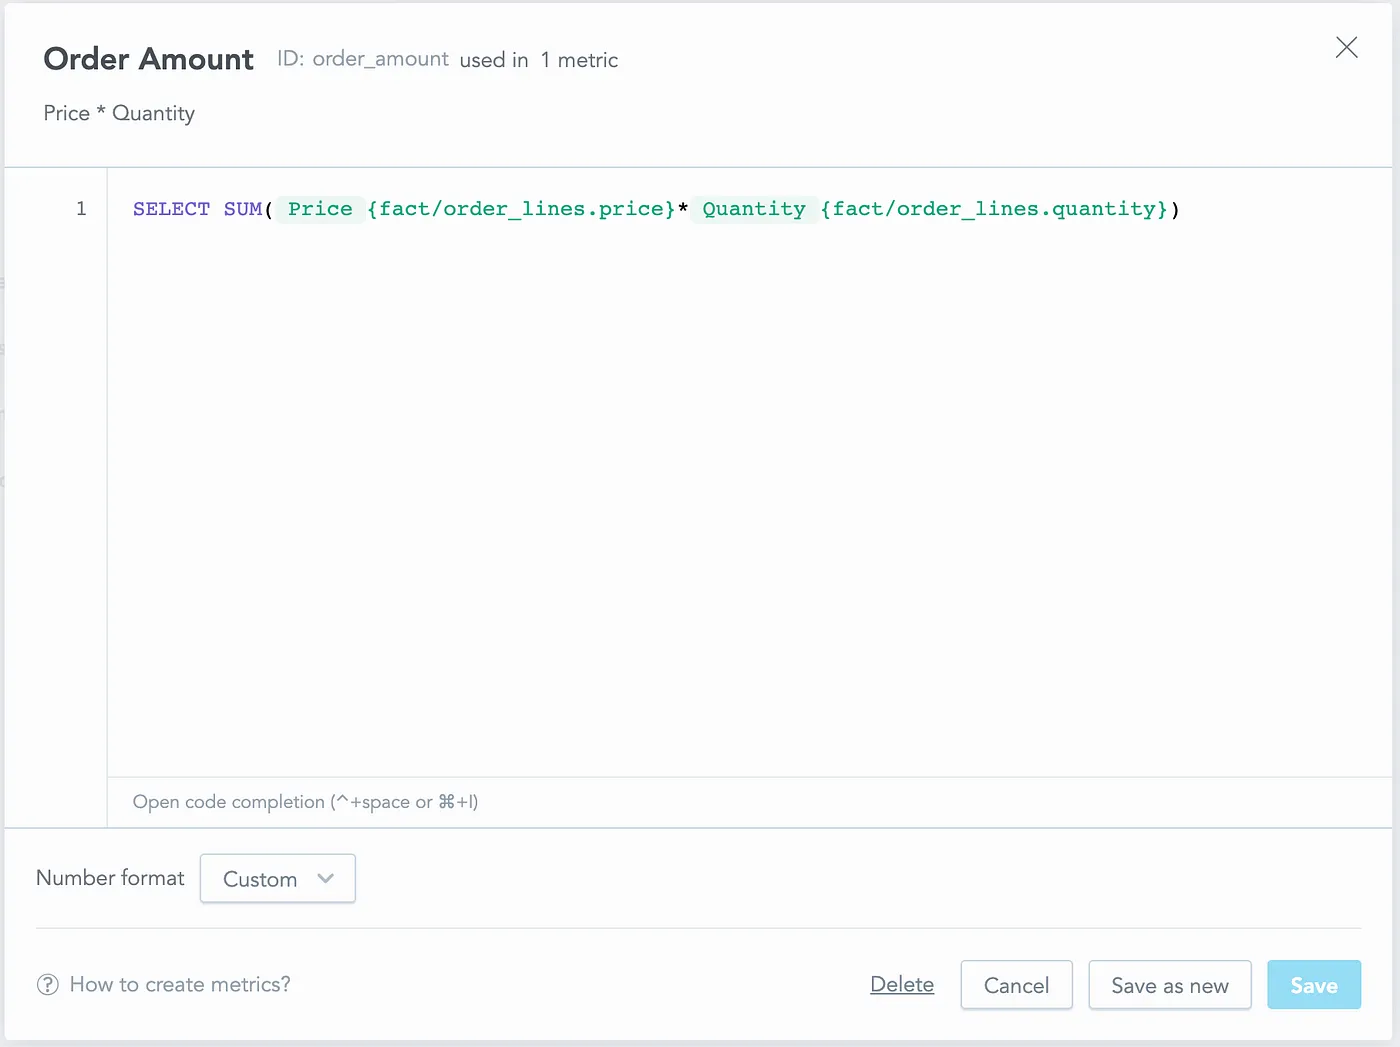
Below is the Order Amount metric used in the Revenue metric:
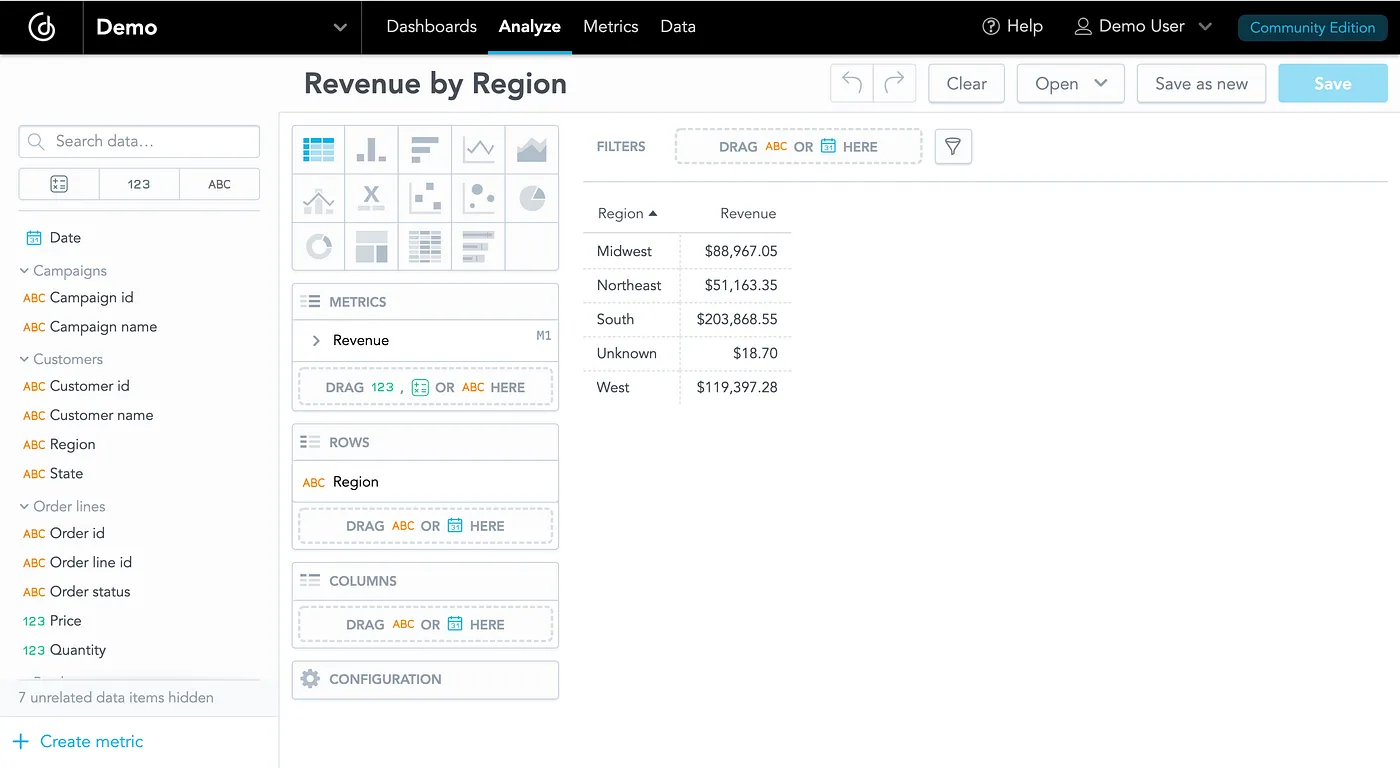
On the Analyze tab, we can create a simple table that slices the revenue by region. The result will serve as a benchmark, as we will re-create it with different data tools in future chapters.
GoodData Foreign Data Wrapper
GoodData Foreign Data Wrapper is a PostgreSQL foreign data wrapper extension. It is built on top of multicore, and it makes GoodData.CN’s metrics, calculations, and data available in PostgreSQL as tables.
We can connect to the running PostgreSQL:
- From console using
psql --host localhost --port 2543 --user gooddata gooddata123 - From any other client using JDBC string:
jdbc:postgresql://localhost:2543/gooddata
Username: gooddata
Password: gooddata123
Once connected, we can work with GoodData.CN Foreign Data Wrapper. At first, we need to define our GoodData.CN server in PostgreSQL.
CREATE SERVER multicorn_gooddata FOREIGN DATA WRAPPER multicorn
  OPTIONS (
    wrapper 'gooddata_fdw.GoodDataForeignDataWrapper',
    host 'http://gooddata-cn-ce:3000', -- host equal to name of container with GoodData.CN.CE
    token 'YWRtaW46Ym9vdHN0cmFwOmFkbWluMTIz', -- default gooddata-cn-ce token, documented in public DOC as well
    headers_host 'localhost'
);Next, we will import the entire semantic model into a special compute pseudo-table. Doing SELECTs from this table will trigger the computation of analytics on GoodData.CN server based on the columns that we have specified on the SELECT.
The compute is called pseudo-table for a reason. It does not adhere to the relational model. The columns that you SELECT map to facts, metrics and labels in your semantic model. Computing results for the select will automatically aggregate results on the columns that are mapped to labels in your semantic model. In other words cardinality of the compute table changes based on the columns that you SELECT.― GoodData Foreign Data Wrapper Documentation
-- This imports the semantic model into the 'compute' pseudo-table.
CALL import_gooddata('demo', 'compute');Consuming a standardized revenue metric
Currently, the revenue metric is used only on the GoodData.CN platform. Let’s see how to access the semantic model and consume the metric with other data tools.
SQL clients
First, the SQL client—DBeaver in this case— needs to be connected to GoodData FDW.
Connection type: PostgreSQL
Host: localhost
Port: 2543
Database: gooddata
Username: gooddata
password: gooddata123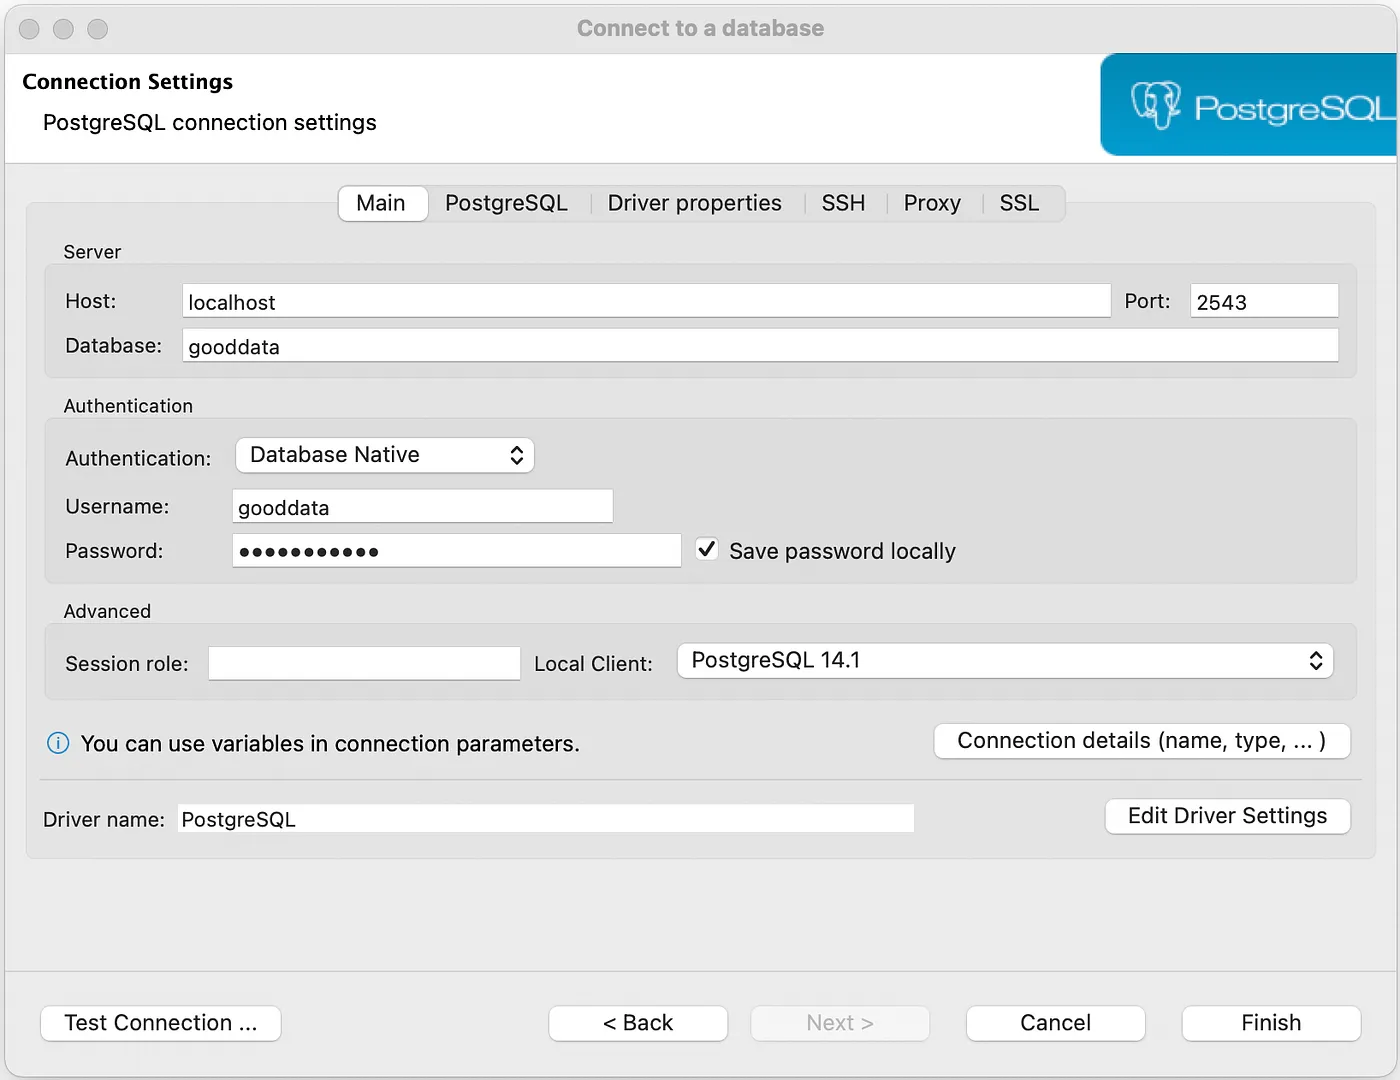
Once the connection is ready, we can write an SQL query to calculate the same Revenue by Region results created earlier in GoodData.CN.
select customers_region, revenue from demo.compute;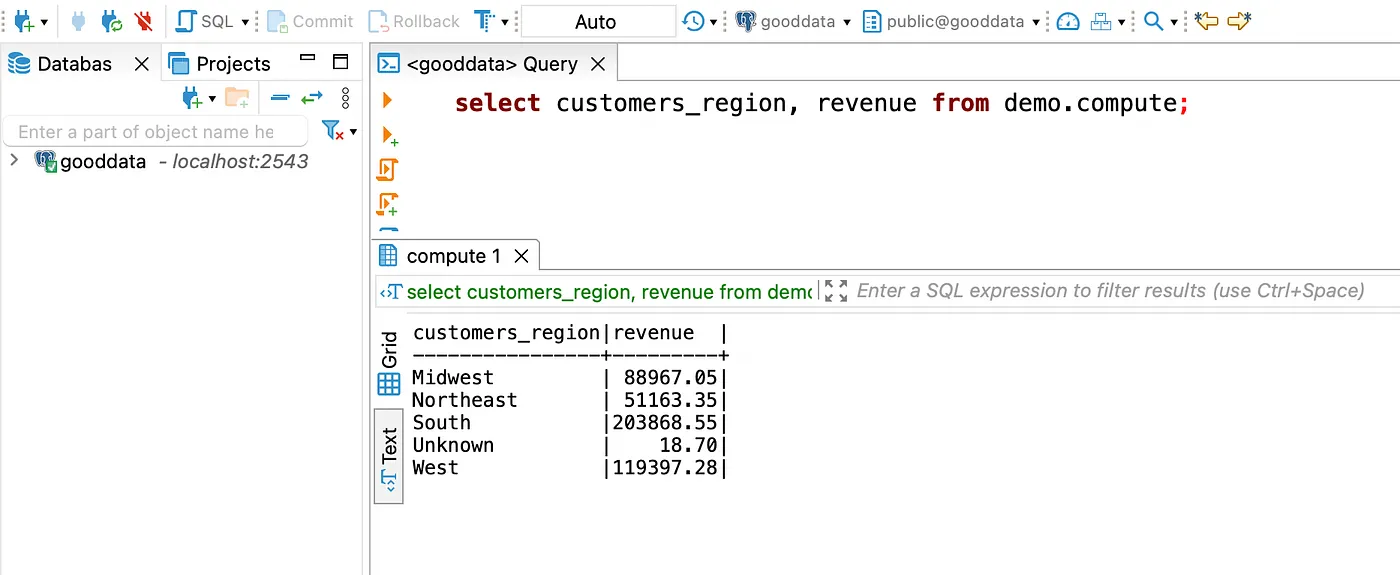
Data science IDEs
To work with Jupyter, let’s start the notebook server from the command line:
$ jupyter notebookNext, we will use ipython-sql to connect to the FDW, run the same SQL query used with DBeaver, and print the Revenue by Region results.
# Install required modules
import sys
!{sys.executable} -m pip install ipython-sql
%load_ext sql
%sql postgresql://gooddata:gooddata123@localhost:2543/gooddatademo_data = %sql SELECT customers_region, revenue FROM demo.compute;
print(demo_data)* postgresql://gooddata:***@localhost:2543/gooddata
5 rows affected.
+------------------+-----------+
| customers_region | revenue |
+------------------+-----------+
| Midwest | 88967.05 |
| Northeast | 51163.35 |
| South | 203868.55 |
| Unknown | 18.70 |
| West | 119397.28 |
+------------------+-----------+BI platforms
As a BI platform, this article uses Metabase, and we will run it locally as a container. The following command starts the Metabase container (note that the original port is changed from 3000 to 12345 because GoodData.CN CE uses the port 3000):
$ docker run -d -p 12345:3000 --name metabase metabase/metabaseOnce the Metabase container is running, we need to create a network to connect the container with the FDW container because—as you guessed—everything is still running locally.
$ docker network create network
$ docker network connect network metabase
$ docker network connect network gooddata-fdw-container-name
Next, we can connect Metabase to the FDW pseudo table with the following details and credentials:
Host: host.docker.internal
Port: 2543
Database name: gooddata
Username: gooddata
password: gooddata123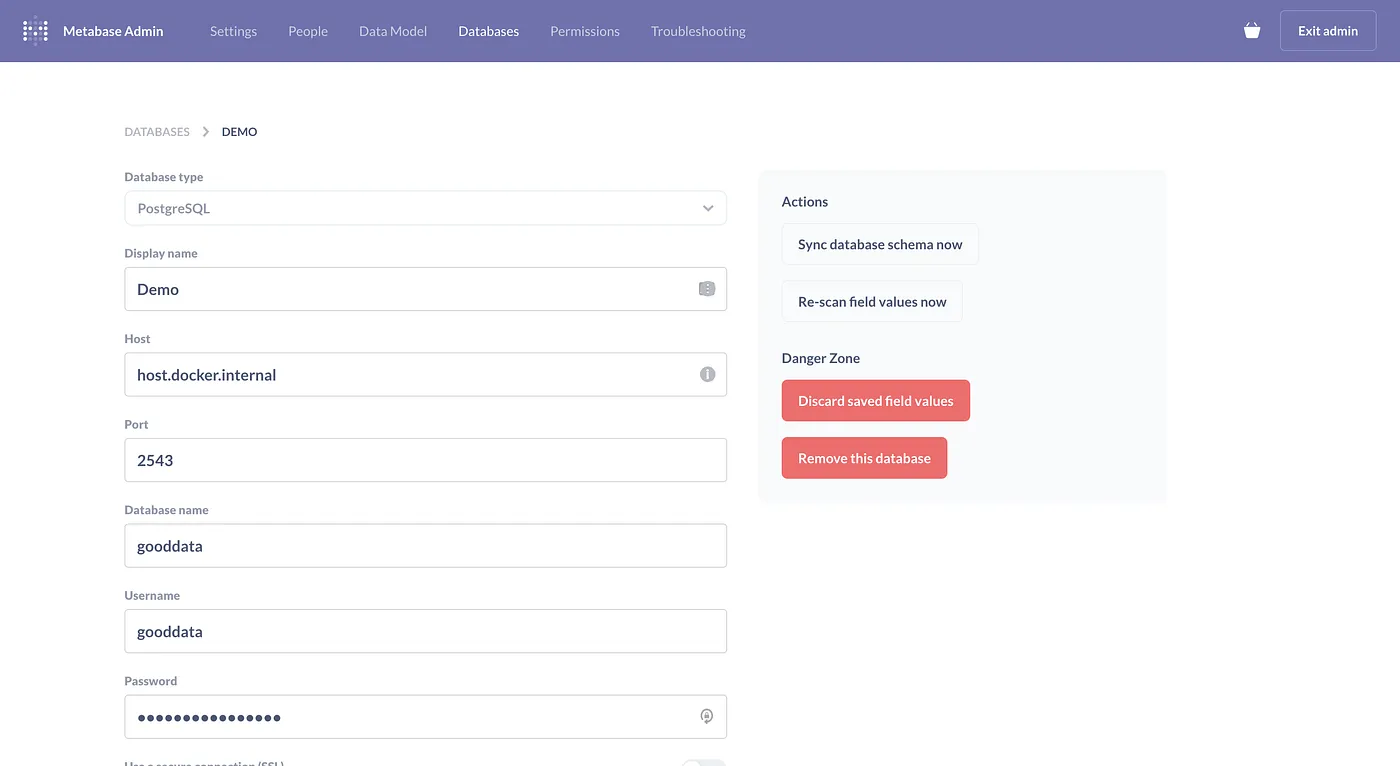
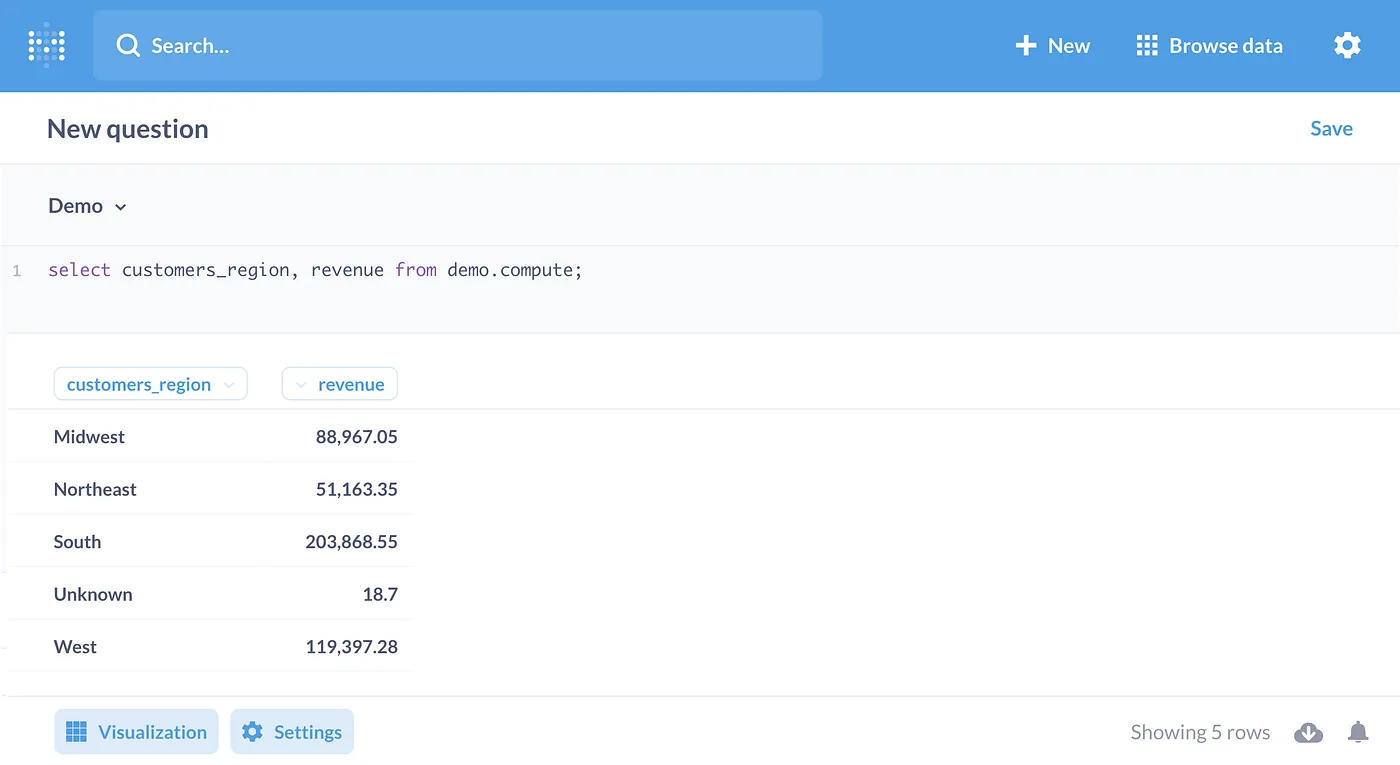
When the connection is complete, we can again use the same SQL query to compute the Revenue by Region results.
React applications
For this part, I created a React application using GoodData.UI accelerator toolkit. It is a CLI-based tool that guides you through creating the application step by step in your terminal application. The tool creates an application that is ready for use with none or minimal additional configuration needed from our side.
To start with the React project, we run the below command in the terminal and follow the instructions provided by the CLI.
npx --ignore-existing @gooddata/create-gooddata-react-app my-appOnce the build is finished, we need to go to the generated directory and start the app with the yarn start command.
cd my-app
yarn start
Then, we follow the directions on the main page and make the following edits to the src/constants.js file.
export const appName = "demo";
export const backend = "http://localhost:3000/";
export const workspace = "demo";
export const workspaceFilter = undefined;Next, we will generate human-readable JavaScript identifiers for the data model objects, which will later be used in the code. First, we export the GoodData.CN authentication token environment variable (the token is the same for all GoodData.CN CE installations), and then run the following command:
export TIGER_API_TOKEN=YWRtaW46Ym9vdHN0cmFwOmFkbWluMTIz
yarn refresh-md
Once the human-readable names for the data model objects and other metadata are generated, we can edit the src/routes/Home.js file to match the following code to create a Revenue by Region table:
import React from "react";
import Page from "../components/Page";
import * as Md from "../md/full";
import { PivotTable } from "@gooddata/sdk-ui-pivot";


const Home = () => {
    return <Page>
    <div style={{ height: 400 }}>
        <PivotTable
            measures={[Md.Revenue]}
            rows={[Md.Region]}
        />
    </div>
</Page>;
};


export default Home;When we return to the browser and go to the Home tab, we see the embedded Revenue by Region results.
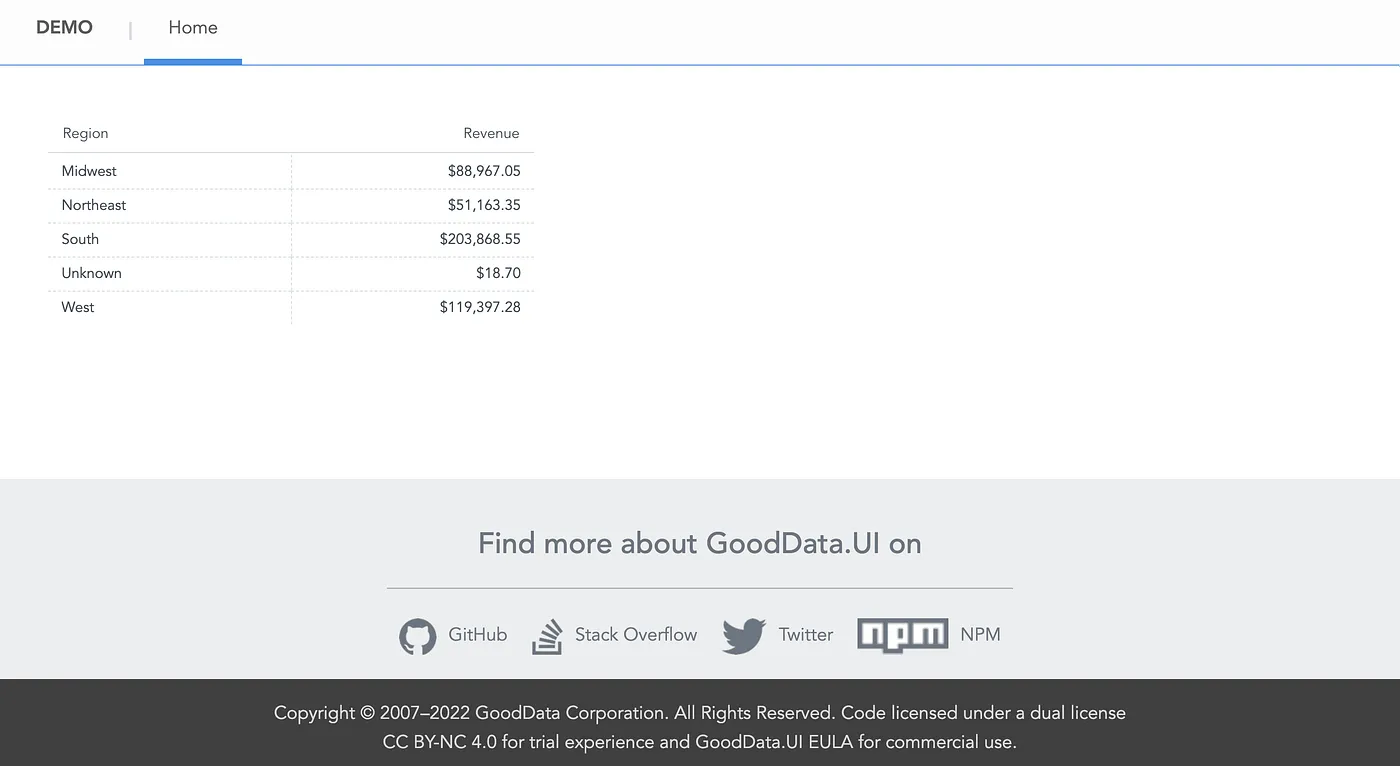
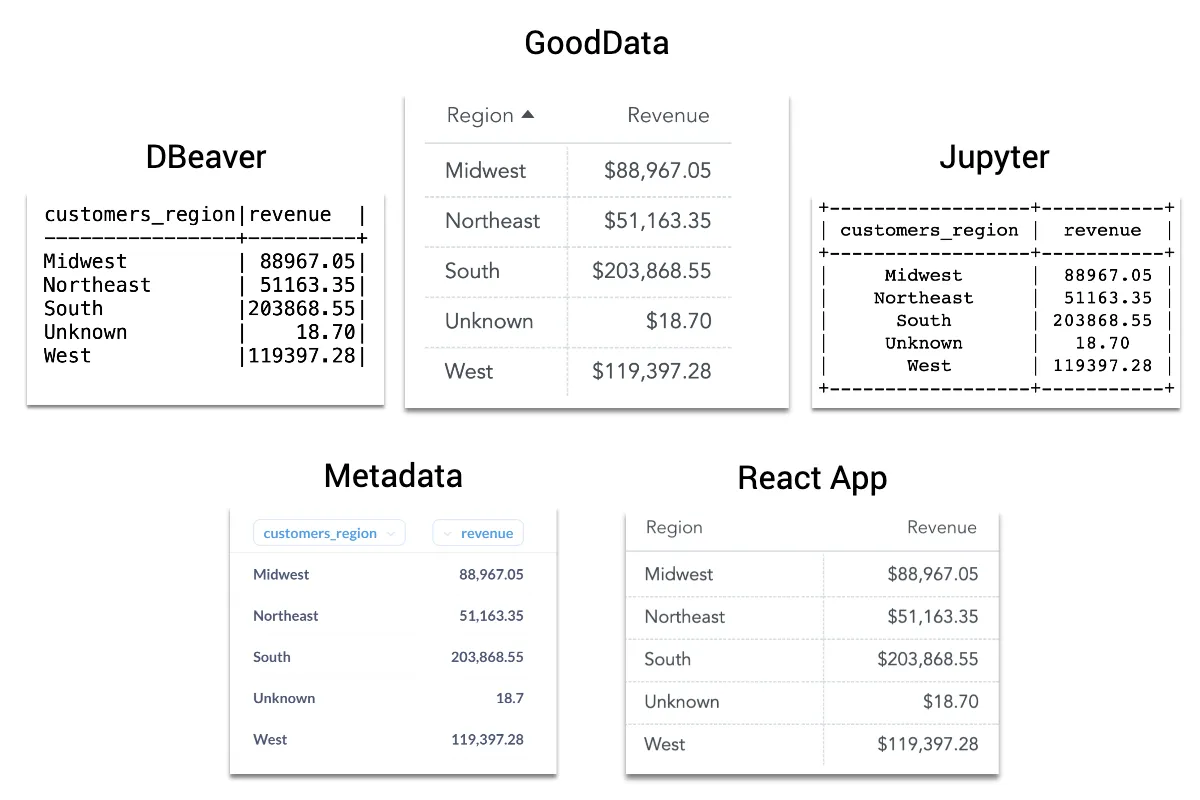
Comparing the results
For ease of comparison, I combined all the results of the previous steps into the image below. As we can see, all tools accessed the same semantic model, consumed the same Revenue metric, and calculated exactly the same results.
Summary
The purpose of this article was to show how easy it is to start standardizing metrics. Standardization means that all our metrics are defined in one place and can be consumed by different data tools, such as SQL clients, Data science IDEs, BI platforms, and applications.
With headless BI, the standardization is achieved by decoupling the analytical backend and computing from consumption and exposing the semantic layer via APIs and standard protocols. Thus, we can work with consistent metrics —with a shared understanding of what our data means— using the tools familiar to us.